卷积神经网络
卷积神经网络的模型有很多,从LeNet,AlexNet,GoogleNet,Inception到ResNet,牢牢把握卷积的核心,其他的网络结构只是加深了层数,和一些trick。本文用mxnet构造一个LeNet网络。
卷积网络的由来
在说卷积神经网络的时候,先来想一下为什么会有卷积神经网络的出现,一定是之前的神经网络有一定的局限性和问题之前是用全连接神经网络,将一张图拉成一向量。
局限性:
1.拉成向量丢失了列上的相关性。
2.全连接神经网络的参数太多。
对卷积的理解是:
拿滤波器对图像进行扫描(对应元素相乘求和)。
学习的时候一直有个疑问:例如:(3,3,2)被 (2,2)过滤,希望得到2层结果,我的理解是两次滤波(对应2层结果),一次滤波过程中,几个滤波器是由输入图像的层数决定的(channel),例如这里的(3,3,2)中的2,
有两个滤波器分别对不同层数(channel)卷积,再对两个卷积结果求和。
对池化的理解是:
卷积过程作用在窗口上,对位置非常敏感,池化层能够缓解这个问题。也可以起到降维减少参数的作用。一般有两种池化方式,最大池化,和平均池化。
下载FashionMnist数据集,并做成数据迭代器
这边有一个地方特别的坑,要注意,一张图片的维度的是(28, 28, 1)多张得到的张量是(batch_size,28,28,1),而在mxnet卷积网络中的输入维度是(batch_size,channel,height,weight),所以这里从FashionMnist中得到的结果需要transpose。可以在很多个地方进行转化,根据自己喜好,我选择在net中进行,并不是最好的方式。再这需要提醒的是权值的维度(output_channel,in_channel,height,weight),可以深入研究权值四个参数在计算中分别代表了什么以及如何计算,参考对上面对卷积的理解1
2
3
4
5
6
7
8
9
10
11from mxnet import ndarray as nd
from mxnet import autograd as ag
from mxnet import gluon
batch_size = 256
def transform(data,label):
return data.astype('float32')/255,label.astype('float32')
mnist_train = gluon.data.vision.FashionMNIST(train=True,transform=transform)
mnist_test = gluon.data.vision.FashionMNIST(train=False,transform=transform)
train_iter = gluon.data.DataLoader(mnist_train,batch_size,shuffle=True)
test_iter = gluon.data.DataLoader(mnist_test,batch_size,shuffle=False)
给参数,为参数设定梯度空间
这边也有一个非常坑的地方,可以尝试不给W初始化范围(weight_scale),看看识别效果。1
2
3
4
5
6
7
8
9
10
11
12
13
14
15
16weight_scale= 0.01
# output channels = 20, kernel = (5,5)
W1 = nd.random_normal(shape=(20,1,5,5),scale=weight_scale)
b1 = nd.zeros(W1.shape[0])
# output channels = 50, kernel = (3,3)
W2 = nd.random_normal(shape=(50,20,3,3),scale=weight_scale)
b2 = nd.zeros(W2.shape[0])
# output dim = 128 感受下W2 和W3的不同
W3 = nd.random_normal(shape=(1250,128),scale=weight_scale)
b3 = nd.zeros(W3.shape[1])
# output dim = 10
W4 =nd.random_normal(shape=(128,10),scale=weight_scale)
b4 = nd.zeros(W4.shape[1])
params = [W1, b1, W2, b2, W3, b3, W4, b4]
for param in params:
param.attach_grad()
构建LeNet网络
我是在这了对输入维度进行transpose的
verbose参数是否打印每层的shape1
2
3
4
5
6
7
8
9
10
11
12
13
14
15
16
17
18
19
20
21
22
23
24
25
26def net(X,verbose):
# X = X.reshape(shape=(-1,1,28,28))
X = nd.transpose(X,(0,3,1,2))
h1 = nd.Convolution(data=X,weight=W1,bias=b1,kernel=W1.shape[2:],num_filter=W1.shape[0])
h1_activation = nd.relu(h1)
h1_pool = nd.Pooling(data = h1_activation,pool_type='max',kernel=(2,2),stride=(2,2))
h2 = nd.Convolution(data=h1_pool,weight=W2,bias=b2,kernel=W2.shape[2:],num_filter=W2.shape[0])
h2_activation = nd.relu(h2)
h2_pool = nd.Pooling(data=h2_activation,pool_type='max',kernel=(2,2),stride=(2,2))
# print('h2_pool',h2_pool.shape)
h2 = nd.flatten(h2_pool)
# print('h2',h2.shape)
#第一层全连接层
h3_liner = nd.dot(h2,W3)+b3
h3 = nd.relu(h3_liner)
# print('h3,W4',h3.shape,W4.shape)
#第二层全连接层
h4_linear = nd.dot(h3,W4)+b4
# print('h4',h4_linear.shape)
if verbose:
print('1st conv block:', h1_pool.shape)
print('2nd conv block:', h2.shape)
print('1st dense:', h3.shape)
print('2nd dense:', h4_linear.shape)
print('output:', h4_linear)
return h4_linear
常规操作之SGD
1 | def SGD(params, lr): |
计算准确率
1 | def accuracy(output,label): |
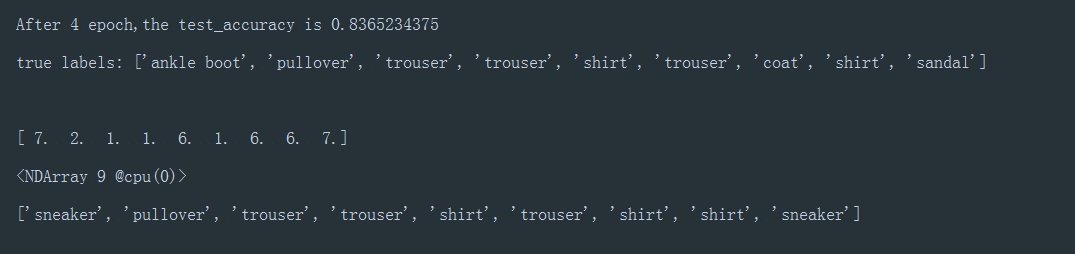
开始训练
1 | epoch = 5 |
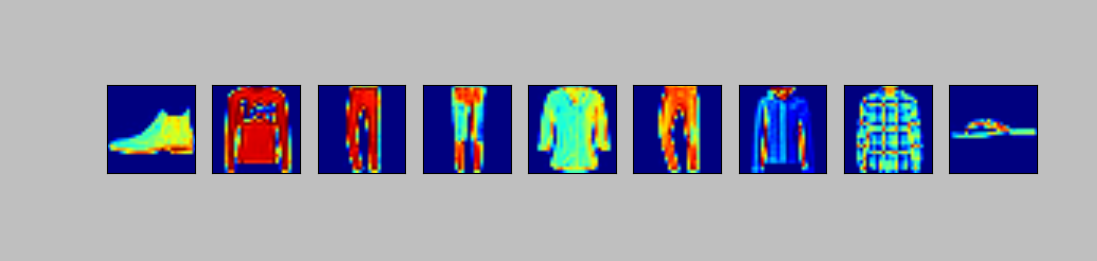
查看分类结果(matplotlib)
1 | import matplotlib.pyplot as plt |
结果上图